- Company
- Products
- Catalogs
- News & Trends
- Exhibitions
Image analysis software module QuantCentervisualizationAIvirtual microscopy
Add to favorites
Compare this product
Characteristics
- Function
- image analysis, visualization, AI
- Applications
- virtual microscopy, for digital microscopes
Description
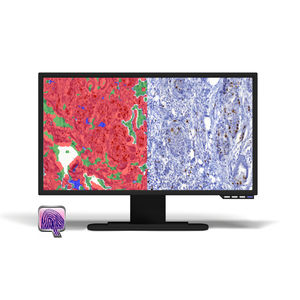
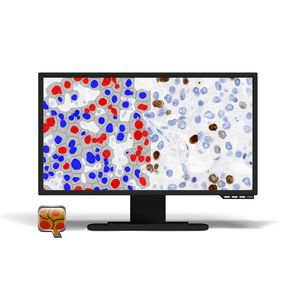
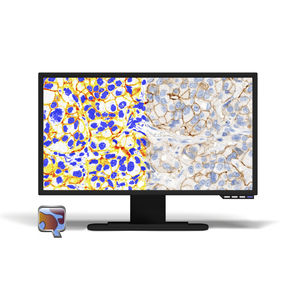
QuantCenter is a multiple-module image analysis platform designed for whole-slide quantification in histopathology and molecular pathology. Thanks to its wide range of linkable modules and the ability to create their own image analysis algorithm, QuantCenter provides researchers with maximum flexibility in quantitative image analysis, contributing to world-class research results.
The latest available version of QuantCenter is 2.3. Please get in touch with us if you are interested!
QuantCenter is intended for use in tissue classification, IHC quantification and molecular pathology. It consists of ten individual modules that can be freely combined for world-class research results:
ScriptQuant: A unique tool for maximum flexibility
ScriptQuant is a brand-new image analysis module for QuantCenter. It provides a shell for user-created image analysis scripts in Python for maximum flexibility for the research user, enabling them to run their own image analysis algorithms within the QuantCenter framework.
Key Features
Arbitrary script editor (VS Code by Microsoft is recommended)
The user-created script can be saved into a scenario and handled like one
Fast visual feedback: write your code and see the results immediately!
ScriptQuant can be extended with external libraries (e.g. OpenCV, TensorFlow…)
Well-documented API and use case examples
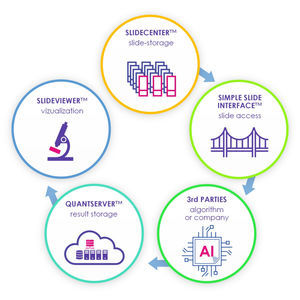
ScriptQuant may provide a gateway for 3rd party AI developers
Quantification results can be fed back into the 3DHISTECH infrastructure:
Storage of quantification results (polygons, objects, regions, measured values)
Visualization in SlideViewer as an overlay
Statistics and Data visualization
Catalogs
Tissue Microarray Solution
12 Pages
*Prices are pre-tax. They exclude delivery charges and customs duties and do not include additional charges for installation or activation options. Prices are indicative only and may vary by country, with changes to the cost of raw materials and exchange rates.


