
- Products
- Catalogs
- News & Trends
- Exhibitions
Management software medical
Add to favorites
Compare this product
Characteristics
- Function
- management
- Applications
- medical
Description
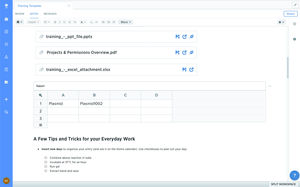
Build and share dashboards and reports, track metrics, and answer questions from your data in Insights.
Give scientists, managers, and executives the answers they need
Operational insights
Dive deeper into resource allocations, processes, and usage to enhance program management, gauge team productivity, and optimize workflows.
Scientific insights
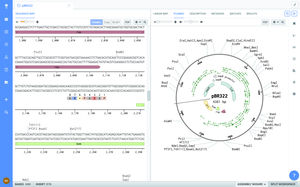
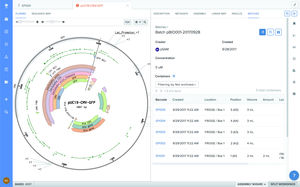
Analyze your data to understand and compare results within, or across, experiments. Leverage these insights to make more informed decisions critical to your R&D pipeline.
Administrative insights
Get a real-time understanding of how Benchling is being used across resources, programs, and teams, and actively understand the level of compliance to existing company regulatory policies around documentation and approvals.
Run analytics on any Benchling data, right inside the product
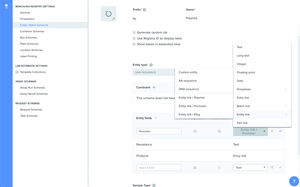
Rapidly derive insights from your data directly within the Benchling platform. Users throughout your organization can access data from across Benchling's natively linked applications, through straightforward SQL queries.
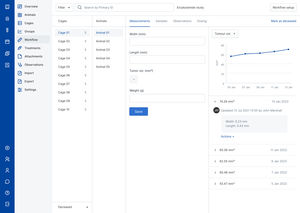
Build dashboards and reports to provide a full view of your R&D
Easily curate dashboards to provide a full view of scientific and operational metrics related to your experiments, programs, and teams. Save developed dashboards and share settings with team members to drive consistency and save time.
Tailor advanced queries to visualize scientific and operational metrics
Compile relevant data through data joins, parameter-setting, and calculations. Build creative queries based on unique questions that matter to your science, and visualize your data through a variety of formats including table, bar, line, and scatter charts.
*Prices are pre-tax. They exclude delivery charges and customs duties and do not include additional charges for installation or activation options. Prices are indicative only and may vary by country, with changes to the cost of raw materials and exchange rates.

