
- Products
- Catalogs
- News & Trends
- Exhibitions
Analysis software Nexus Copy Number™visualizationNGSmedical
Add to favorites
Compare this product
Characteristics
- Function
- analysis, visualization, NGS
- Applications
- medical
- Operating system
- Windows
Description
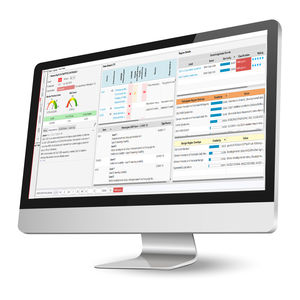
The Nexus Copy Number software enables researchers to analyze multiple data types—arrays, NGS panels, WES/WGS, and expression data—across research cohorts for a genome-wide view. Reveal new insights with incredible simplicity through a variety of advanced analysis and visualization tools.
Integrate phenotypic and genomic data to uncover significant genetic correlations.
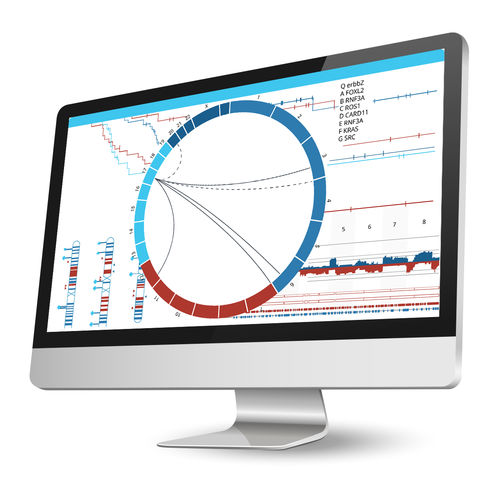
Associate an unlimited number of sample annotations or attributes for further downstream analyses. Use the predictive power tool to find correlations between phenotypic attributes and genomic changes, perform survival analysis for cancer samples (with Kaplan-Meir plots), or stratify samples based on aberration profiles and phenotypes to identify driver mutations. Nexus Copy Number enables grouping using K-means or hierarchical clustering with the ability to adjust the number of clusters. Identify gene ontology (GO) terms enriched over the entire genome using GSEA or find GO terms significantly over-represented in selected regions only. Use the concordance function to identify genomic alterations co-occurring with copy number changes, LOH regions, or small mutations, and depict these relationships in a circle plot.
Analyze and visualize multiple samples in parallel—no bioinformatics expertise required.
Nexus Copy Number provides you with robust statistical functions and rich interactive graphics, without the need for graphical and statistical programming expertise. It is a powerful desktop (Windows or Mac OS) solution allowing visualization and analysis of tens of thousands of high-density arrays in parallel.
*Prices are pre-tax. They exclude delivery charges and customs duties and do not include additional charges for installation or activation options. Prices are indicative only and may vary by country, with changes to the cost of raw materials and exchange rates.


