Medical software data managementviewermonitoring
Add to favorites
Compare this product
Characteristics
- Applications
- medical
- Function
- data management, viewer, monitoring, recording, evaluation, vital sign telemonitoring
- Deployment mode
- web-based
Description
The web-based user interface simplifies access and visual representation of the recorded vital signs data. Access is password-protected and the vital signs data is pseudonymized. Numerous individual configuration options for recording and transmitting vital signs data are possible. This makes it much easier to adapt the cosinuss° remote monitoring technology to any specific application.
Features overview
Data visualization
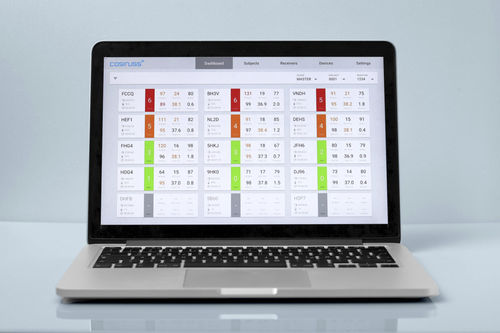
Dashboard: Overview of the vital signs of all monitored persons.
Detail view: Detailed data view of every single measurement point for each person.
Data management
Measured persons: Create new persons and link them to devices.
List views: Overview of all persons, devices and projects.
Configuration of measurements: Adjustment of measurement interval and duration.
User roles: Management of different access rights.
Data visualization
Dashboard
The dashboard is the central information center of the user interface for vital signs monitoring. In the dashboard, the vital signs data of all individual subjects can be clearly tracked. A tiled overview displays the current health status of each subject, all available vital signs, all quality indices, and information about the battery and connection status of the in-ear sensors used.
Detail view
A detailed representation of the individual parameters including all PPG raw data over the entire time course of the measurements can be found in the respective detailed view. Displayed in an interactive graphical representation, the evaluation of the data is visually accessible and intuitive. Additional information on all devices used and an automatic documentation of all server activities are also listed here.
Catalogs
No catalogs are available for this product.
See all of cosinuss°‘s catalogs*Prices are pre-tax. They exclude delivery charges and customs duties and do not include additional charges for installation or activation options. Prices are indicative only and may vary by country, with changes to the cost of raw materials and exchange rates.


