- Primary care
- Emergency medicine, Resuscitation
- Training simulator
- Health Edco & Childbirth Graphics

- Company
- Products
- Catalogs
- News & Trends
- Exhibitions
Diabetes awareness simulator 75485for demonstrationfor general care
Add to favorites
Compare this product
fo_shop_gate_exact_title
Characteristics
- Procedure
- for demonstration
- Application
- for general care
- Simulated pathology / condition
- for diabetes awareness
Description
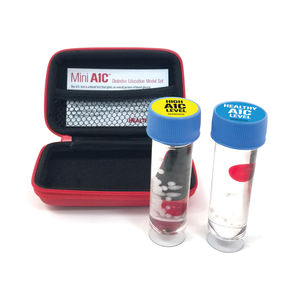
Use this essential model to explain A1C levels to patients. One half of the model represents healthy blood glucose and A1C levels by depicting a small number of glucose particles and a red blood cell model that has few glucose particles attached to it. In contrast, the model’s other red blood cell contains excess glucose particles and floats through simulated plasma full of glucose particles, representing high A1C and blood glucose levels. Perfect for breaking down the meaning of A1C levels in easy-to-understand terms. Comes with an informative, 100-sheet, English/Spanish tear pad.
Catalogs
Related Searches
- Demonstration simulator
- General care medical simulator
- Training manikin
- Upper body simulator
- Pad simulator
- Injection simulator
- General care training manikin
- Lower body simulator
- Vital sign simulator
- Upper body training manikin
- Emergency care simulation unit
- Woman simulator
- Suture simulator
- Plastic simulator
- Obstetrical/gynecological simulator
- Kit simulation trainer
- CPR training manikin
- Catheterization simulator
- Palpation simulator
- Anatomy simulation trainer
*Prices are pre-tax. They exclude delivery charges and customs duties and do not include additional charges for installation or activation options. Prices are indicative only and may vary by country, with changes to the cost of raw materials and exchange rates.


