- Laboratory
- Physico-chemical analysis
- Fluorometer
- HORIBA Scientific
CDOM fluorometer Aqualog®for environmental analysisfor the food industry

Add to favorites
Compare this product
fo_shop_gate_exact_title
Characteristics
- Applications
- for environmental analysis, for the food industry, CDOM
Description
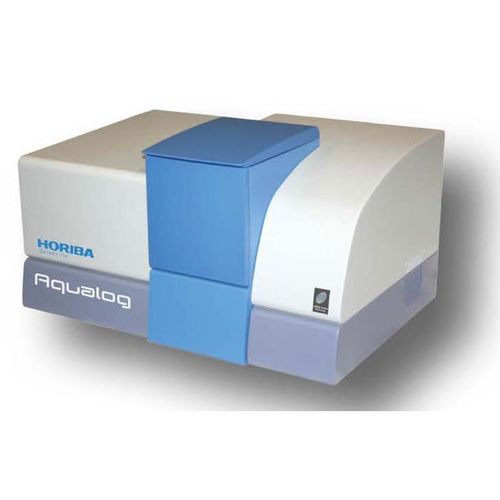
The HORIBA Aqualog is a unique optical spectrometer that is the gold standard in environmental water research around the world for the study of color dissolved organic matter (CDOM).
The Aqualog was invented to meet the needs of environmental water researchers around the world studying CDOM using fluorescence spectroscopy. At that time researchers were using scanning spectrofluorometers to slowly acquire a three dimensional matrix of the fluorescence excitation and fluorescence emission spectra, called an Excitation Emission Matrix (EEM). The EEM provides a fingerprint for studying dissolved organic matter, however it took up to an hour to collect a single EEM profile, tying the researcher to the lab bench for the entire day. The HORIBA Aqualog vastly improves the speed with which fluorescence EEMs are collected, dramatically increase the dynamic range across which EEM fingerprints are quantitative, and simultaneously acquires absorbance spectra for absorbance and color analysis of non-fluorescent molecules present in water. We call this technique that the Aqualog employs, an Absorbance-Transmission Excitation Emission Matrix, or A-TEEMTM.
Traditional scanning spectrofluorometers have been used to collect a molecular fingerprint, in the form of a fluorescence excitation emission matrix, or EEM. Sometimes also referred to as 3D Fluorescence, an EEM is a three-dimensional data set of fluorescence excitation wavelength versus fluorescence emission wavelength versus fluorescence intensity. With a scanning spectrofluorometer,
VIDEO
Catalogs
Aqualog®
2 Pages
Related Searches
- Microscopy
- Compound microscope
- Laboratory microscope
- Tabletop microscope
- Spectroscope
- LED illuminator
- Digital microscope
- USB microscope
- Benchtop spectroscope
- Temperature analyzer
- Research microscope
- Fluorescence microscope
- High-definition microscope
- Compact illuminator
- Compact microscope
- Microscope illuminator
- Polarization microscope
- Calibration analyzer
- Halogen microscope
- Inverted microscope
*Prices are pre-tax. They exclude delivery charges and customs duties and do not include additional charges for installation or activation options. Prices are indicative only and may vary by country, with changes to the cost of raw materials and exchange rates.


