Analysis software msRepeatFindersharingmedicalfor mass spectrometry
Add to favorites
Compare this product
Characteristics
- Function
- analysis, sharing
- Applications
- medical, for mass spectrometry
- Operating system
- Windows
Description
Visualizes complicated mass spectral data and accelerates information sharing !
Features
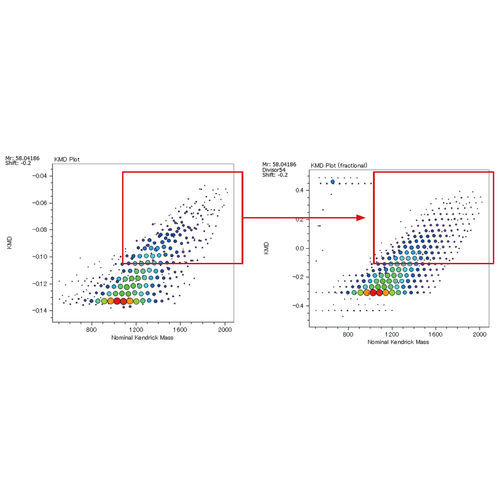
Kendrick Mass Defect (KMD) analysis and its application to synthetic polymers
Kendrick Mass Defect (KMD) analysis is a method proposed by Edward Kendrick in 1963 [1] that is still used today in the petrochemical field. In mass spectrometry, an accurate mass obtained by a high resolution mass spectrometer uses a unit system with its mass of 12C being 12.0000 u, while Kendrick mass (KM) uses a unit system of CH2 = 14.00000. It is possible to classify the mass spectrum peaks of an extremely complex mixture mainly consisting of hydrocarbons, such as crude oil, according to the degree of unsaturation of the hydrocarbons and the presence or absence of heteroatoms.
The National Institute of Advanced Industrial Science and Technology (AIST) and JEOL Ltd. have succeeded in applying the principle of the Kendrick mass defect method to the analysis of high resolution mass spectra of polymers [2]. In this case, KM is defined so that the exact mass of the monomer, which is a repeating unit, is an integer. Creating a Kendrick Mass Defect (KMD) plot allows you to visualize the types and numbers of polymers in complex mass spectra without assigning individual mass spectrum peaks. Recently, the Fraction Base KMD method, Remainder of KM method, etc. have been proposed as related technologies that can be applied to the analysis of polymers over a wide mass range, and to the structural analysis of polymers by MS/MS. These KMD technologies not only shorten the time required for polymer analysis, but also facilitate information sharing.
Catalogs
No catalogs are available for this product.
See all of Jeol‘s catalogsRelated Searches
- Analysis software
- Microscopy
- Compound microscope
- Laboratory microscope
- Tabletop microscope
- Microscope with LED light
- Viewer software
- Clinical chemistry analyzer
- Laboratory software
- Windows software
- Reporting software
- Automatic clinical chemistry analyzer
- Benchtop clinical chemistry analyzer
- Acquisition software
- Treatment software
- Measurement software
- Biological microscope
- Blood clinical chemistry analyzer
- Binocular microscope
- Research microscope
*Prices are pre-tax. They exclude delivery charges and customs duties and do not include additional charges for installation or activation options. Prices are indicative only and may vary by country, with changes to the cost of raw materials and exchange rates.


