Analysis software MarkerView™visualizationreportingfor mass spectrometry
Add to favorites
Compare this product
Characteristics
- Function
- analysis, visualization, reporting
- Applications
- for mass spectrometry
Description
Designed with non-statisticians in mind and intuitively developed, MarkerView™ Software does the heavy lifting so you can focus on high-value decisions like reviewing trends and differences in targeted/untargeted mass spec workflows. Distil complex datasets quickly, find statistically significant differences and reveal key insights faster.
Powerful - Interrogate your data with powerful statistical tools, such as Principle Components Analysis (PCA), Principle Components Variable Grouping (PCVG) and T-tests.
Simple - Find significant trends and differences to get to your biological answers easily. MarkerView Software enables you to interpret your results through intuitive and interactive plots. -
Flexible - Directly import your processed results from SWATH® Acquisition 2.0, LipidView™ Software, MasterView™ Software or SCIEX OS Software into MarkerView Software to generate
Interpret Complex Lipidomics Datasets More Efficiently
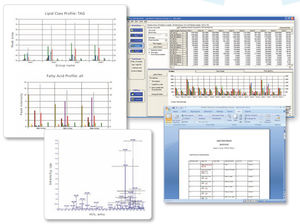
Lipids are efficiently identified and quantified in LipidView Software. After which, lipid expression trends can be visualized across all biological samples using Principal Component Analysis (PCA) in MarkerView Software. The principal component variable grouping (PCVG) clusters lipids according to its similar quantitative profiles.
Comparative Lipid Profiling in MarkerView Software. The phospholipids and cardiolipins (loadings plot, right) differentiate the three groups of samples (scores plot, left). This data was collected on the TripleTOF® 6600 system from a lipidomics profiling study.
Catalogs
Related Searches
- Solution reagent kit
- Molecular biology reagent kit
- Analysis software
- Viewer software
- Control software
- Quality control reagent kit
- Laboratory software
- Windows software
- Reporting software
- Automated software
- Monitoring software
- Acquisition software
- Tracking software
- DNA purification reagent kit
- Research software
- Calibration reagent kit
- Interpretation software
- DNA reagent kit
- Screening software
- Validation software
*Prices are pre-tax. They exclude delivery charges and customs duties and do not include additional charges for installation or activation options. Prices are indicative only and may vary by country, with changes to the cost of raw materials and exchange rates.


