- Company
- Products
- Catalogs
- News & Trends
- Exhibitions
Data management software TC-Log visualizationmonitoringacquisition
Add to favorites
Compare this product
Characteristics
- Function
- data management, visualization, monitoring, acquisition, calibration
- Applications
- medical, for temperature dataloggers
- Operating system
- Windows
Description
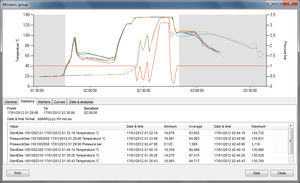
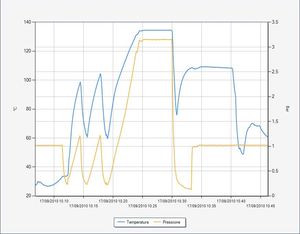
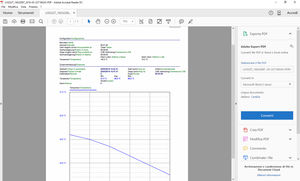
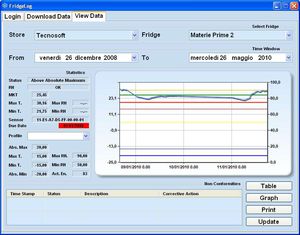
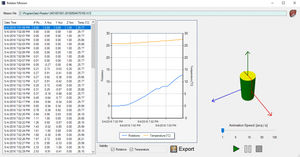
TC-Log (all versions) management software. Start and download loggers, connect multiple loggers together and see both graph and table of each. Possibility to select the curves to show on the graph and to monitor real time data when loggers are connected by means of the interface. Export data into excel and print complete reports. Possibility to calibrate each sensor by the user.
Main features
Multiple connection
Graph and table for all data
Offset over time for each curve
Selectable curves on the graph
Export data into excel
Real time monitoring (with loggers connected)
Calibration feature
Plus
Intuitive and easy to use
Real time monitoring with or without logging on devices internal memory
Calibration system easy and immediate (up to 10 points per each sensor can be calibrated)
Calibration files can be exported and imported on other systems
Data management - Archive for missions identified by serial number and start time/date of the data logger.
Data display - Graph with zomm, table, printed report with all data, graph, statistics
Data display - Realt time visualization of current data
Real time mode - With logger connected possibility to real time monitor all enabled sensors
Calibration mode - With TC-Log software, possibility to set a calibration for each sensor
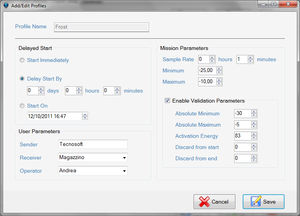
Customizable parameters - Acquisition step, mission duration
Catalogs
Related Searches
- Analysis software
- Viewer software
- Control software
- Laboratory software
- Tecnosoft Windows software
- Tecnosoft monitoring software
- Hospital software
- Acquisition software
- Data management software
- Recording software
- Data analysis software
- Evaluation software
- Software for the pharmaceutical industry
- ISO software
- Universal software
- Telemonitoring software
- Data logging software
- Tecnosoft temperature datalogger software
- Temperature monitoring software
*Prices are pre-tax. They exclude delivery charges and customs duties and do not include additional charges for installation or activation options. Prices are indicative only and may vary by country, with changes to the cost of raw materials and exchange rates.


